Undergraduate CAEP Education Data
The Educator Preparation Programs (EPP) is the primary coordinating body for all of CMU’s teacher preparation and continuing education programs which are distributed across five colleges and involve 20 departments and three interdisciplinary councils. The EPP consists of more than 150 professional education faculty members, the Director of Educator Preparation, the dean of the College of Education and Human Services, and the dean or dean’s designee of each involved college. The work of the EPP is supported by the Office of Educator Preparation Programs housed in the College of Education and Human Services. The EPP offers 8 graduate programs at the master’s and specialist levels and 20 areas of specialized study at the undergraduate level accredited by CAEP. CMU has been a leader in teacher education programs since it was founded in 1892 and graduates more than 300 teacher candidates annually.
EPP by the Numbers
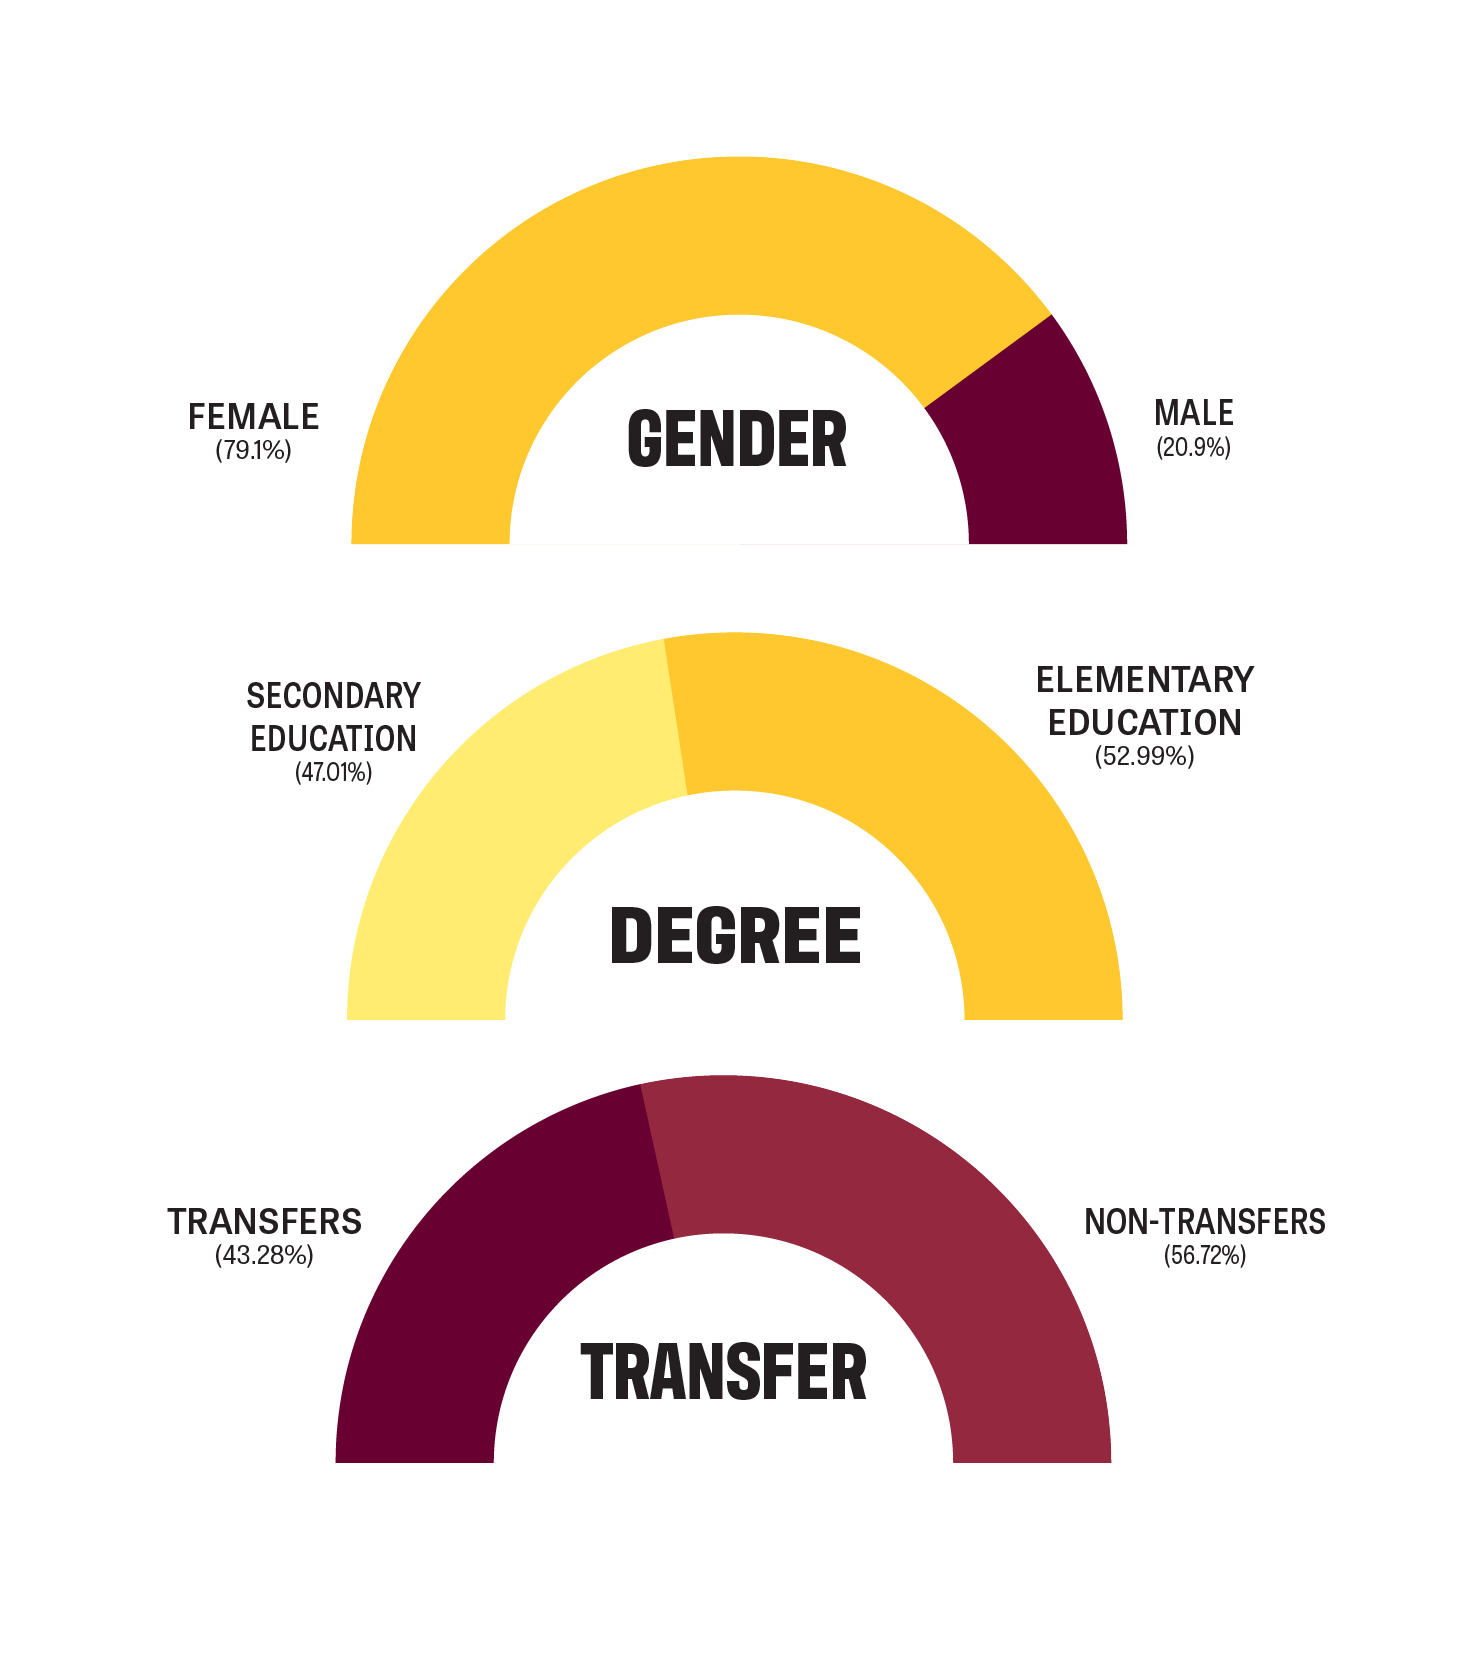
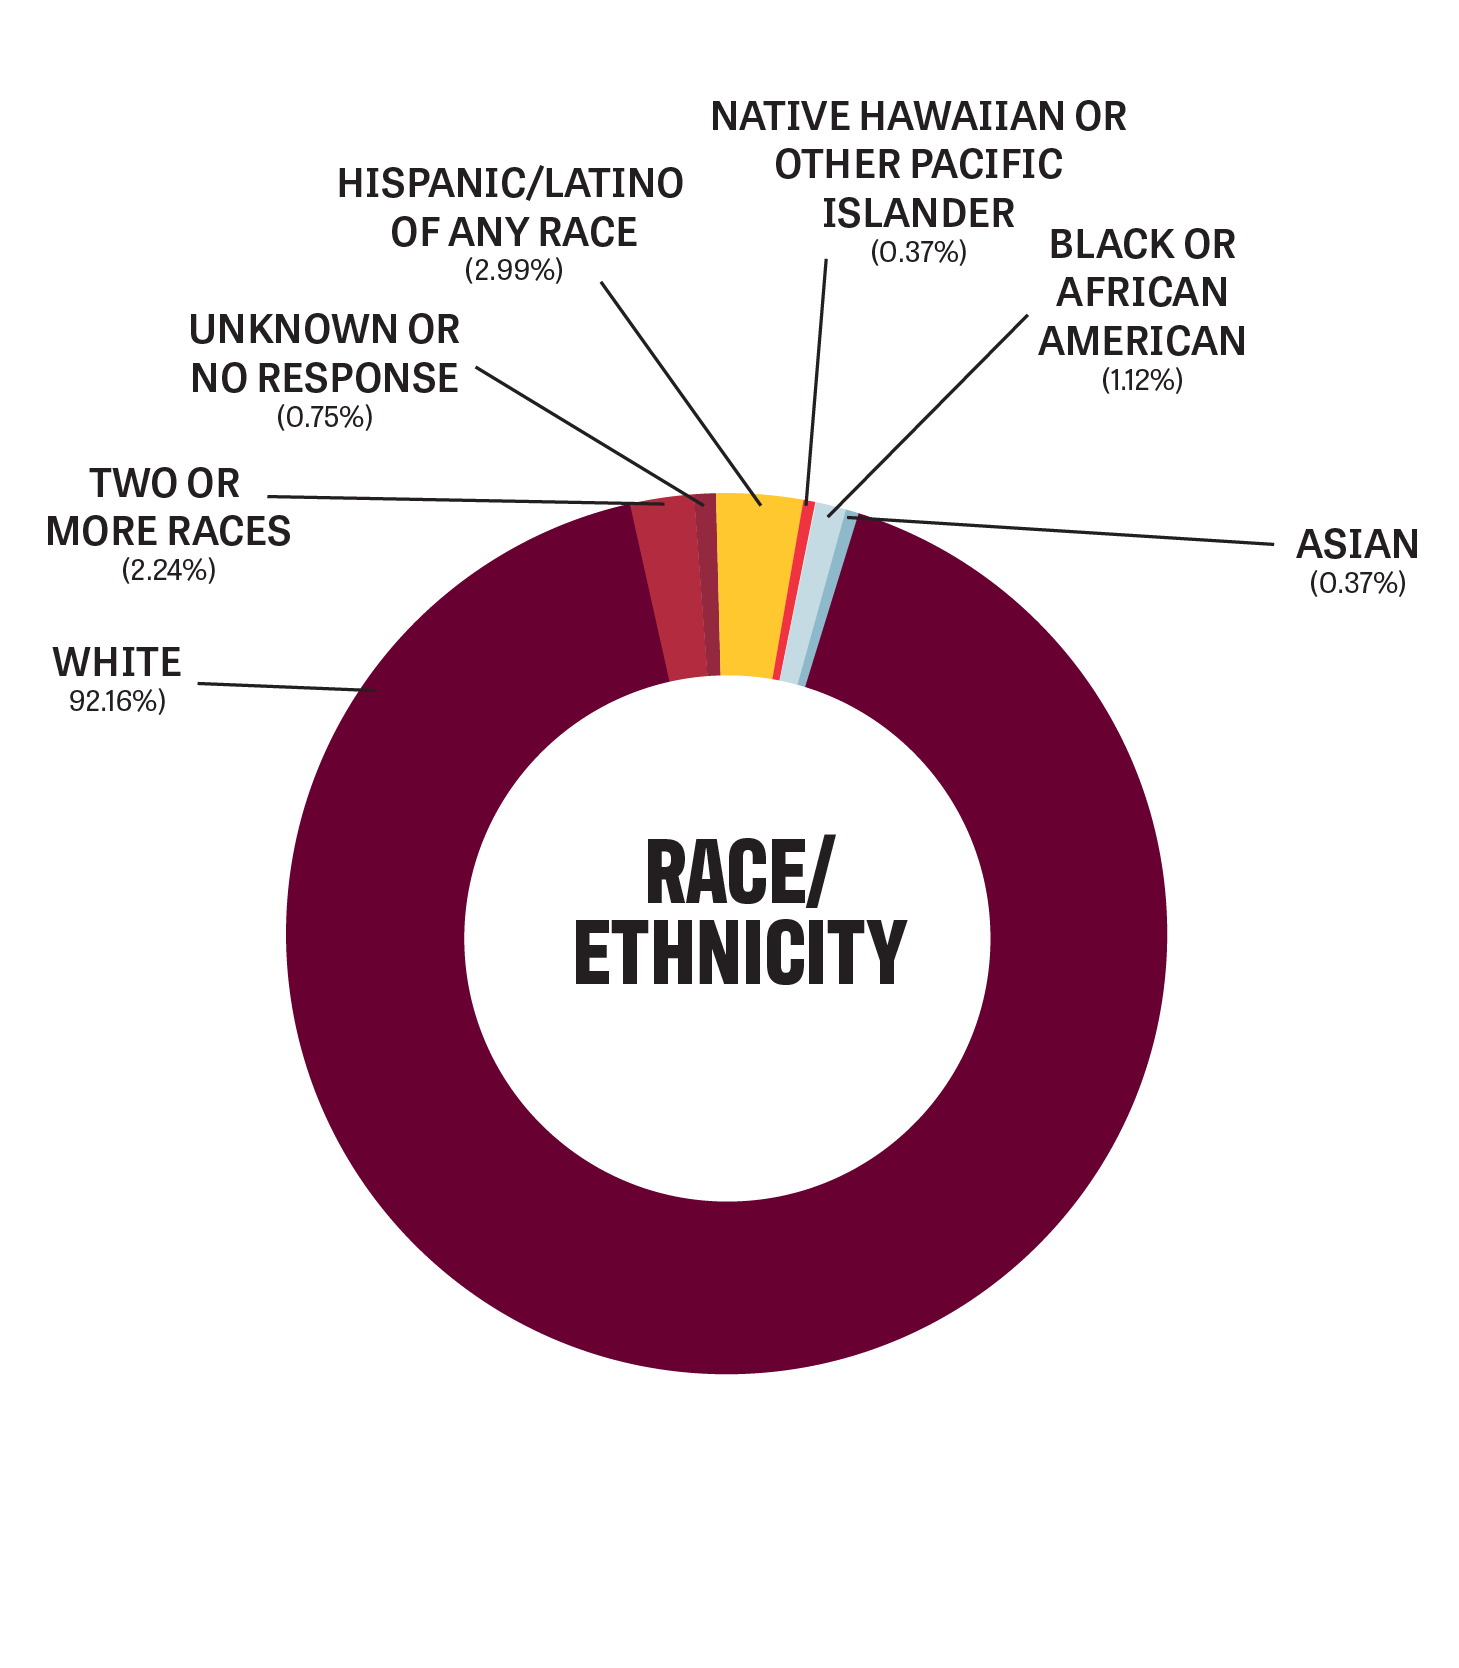
EPP Demographics: admitted and enrolled candidates
2021-2022 total number of admitted and enrolled = 965

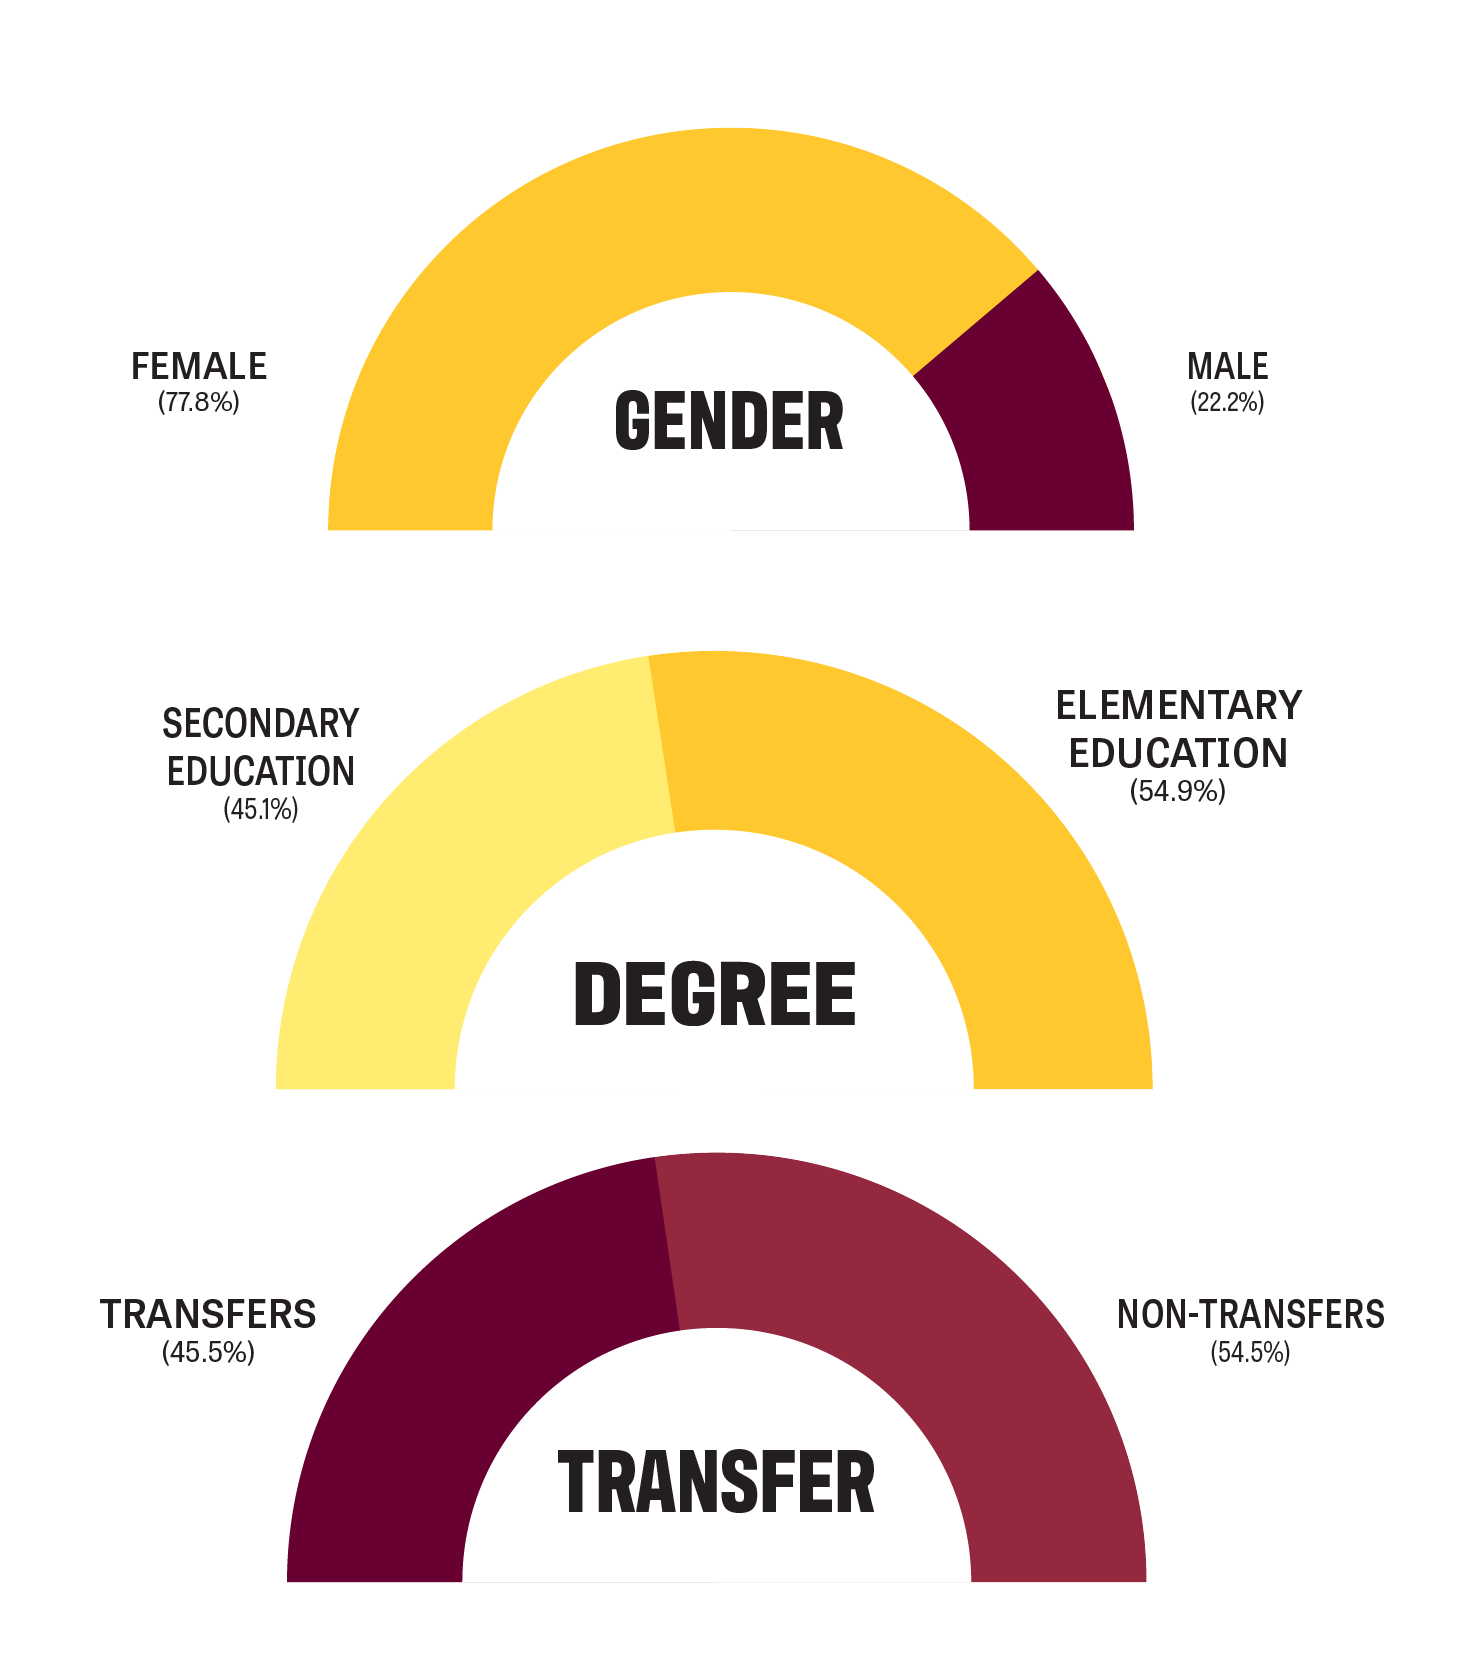
EPP Demographics: program completers
2021-2022 total number of completers=268
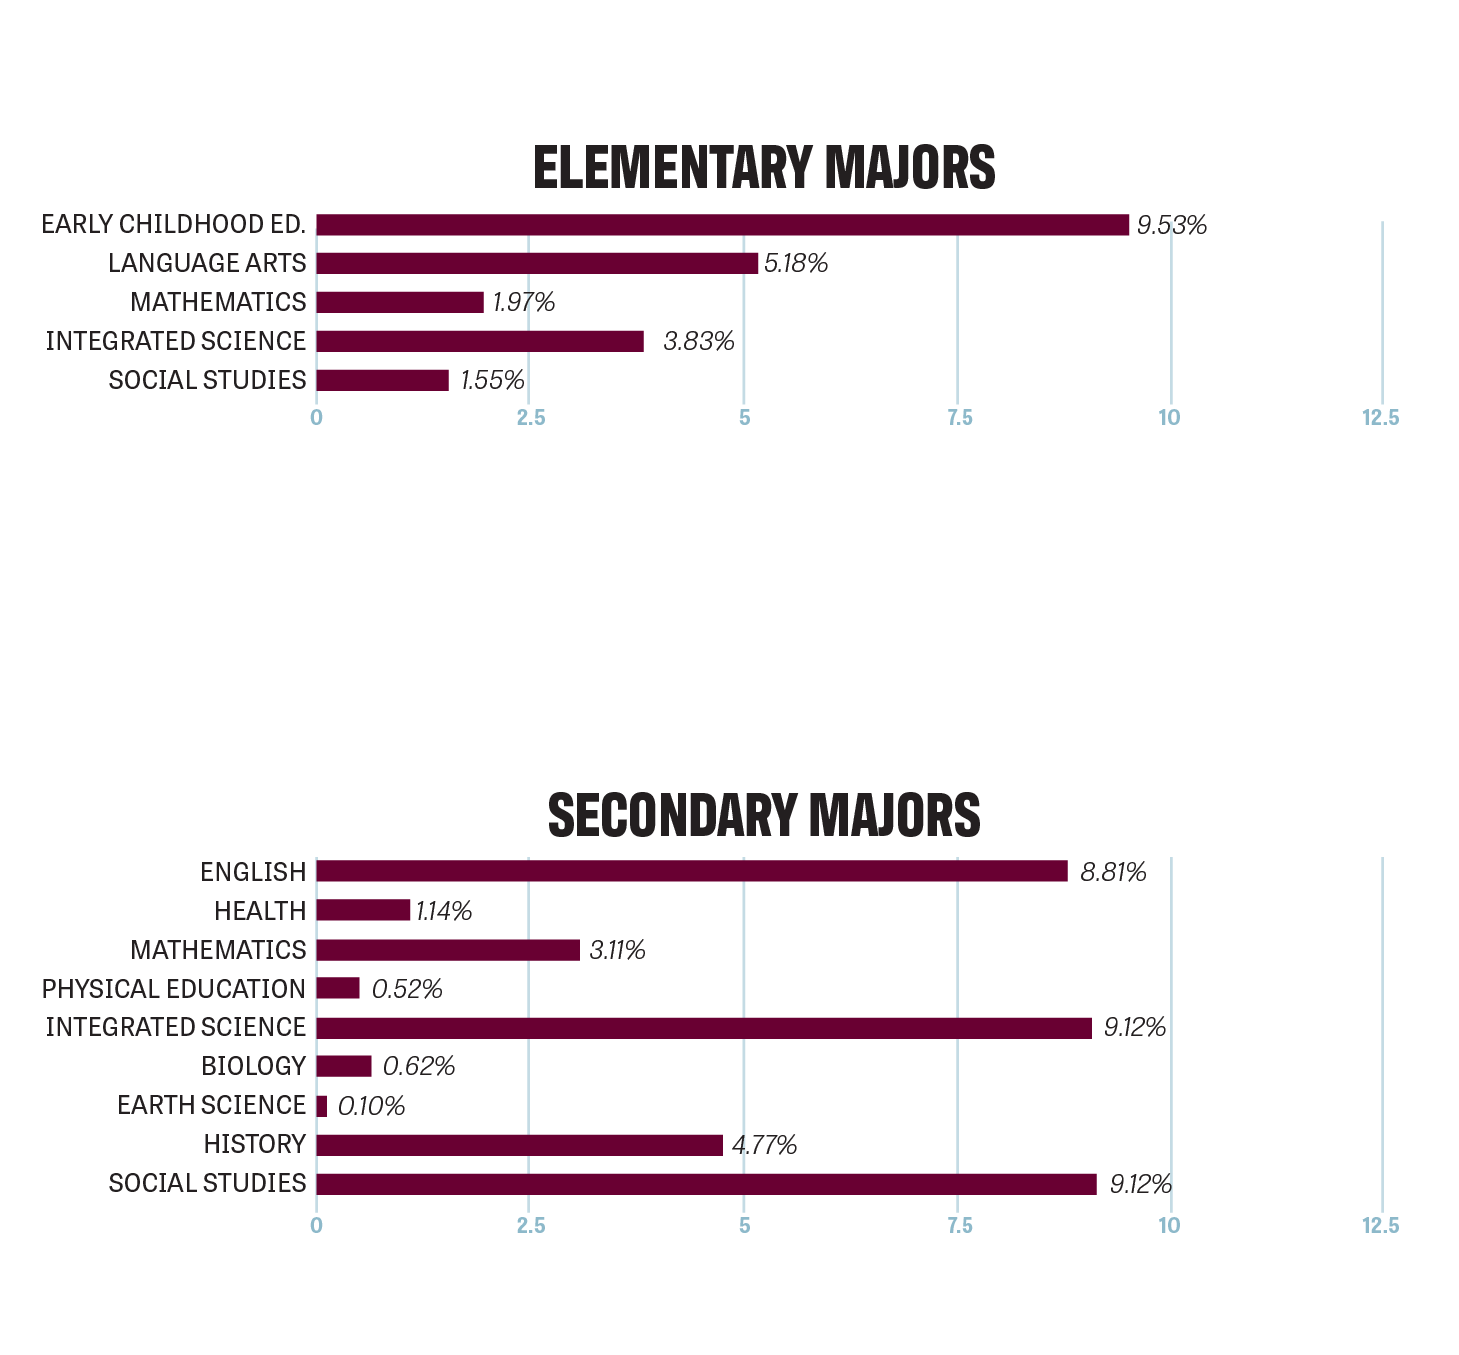
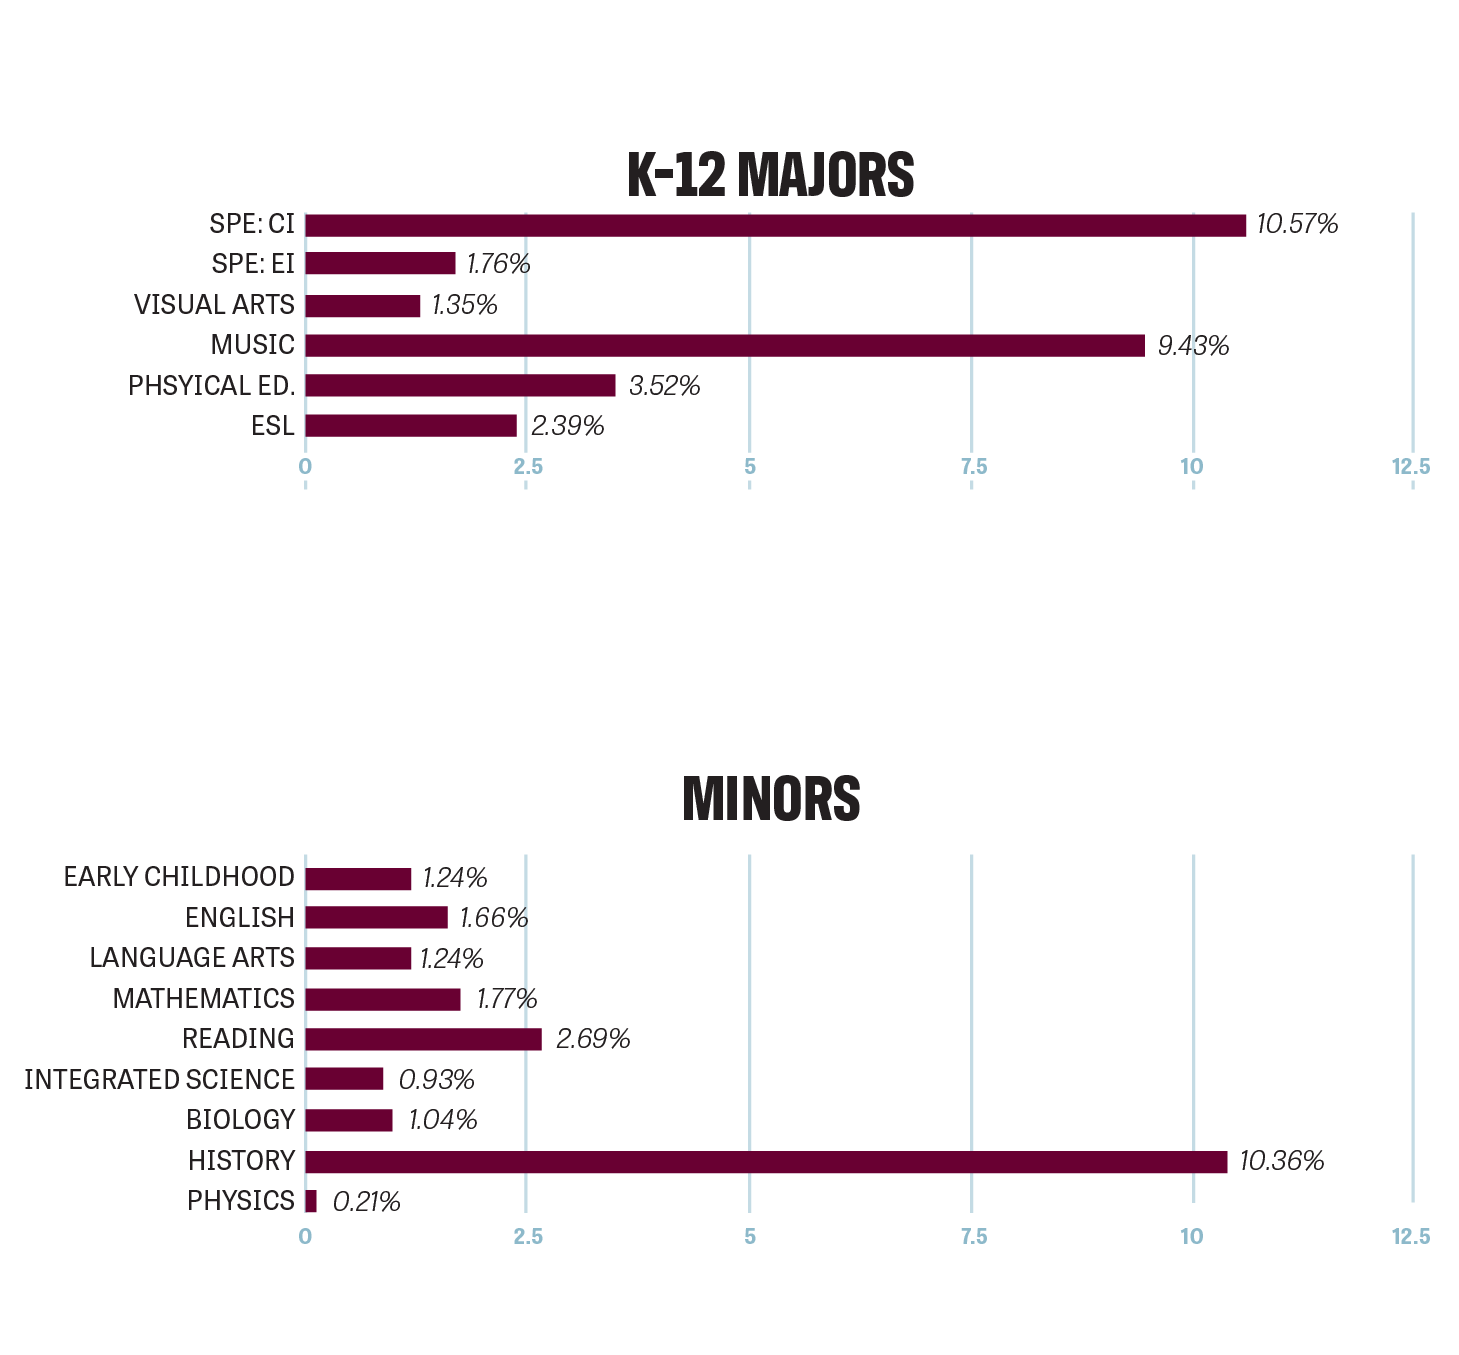
Major and Minor Distribution: admitted and enrolled
2021-2022 total number admitted and enrolled=965
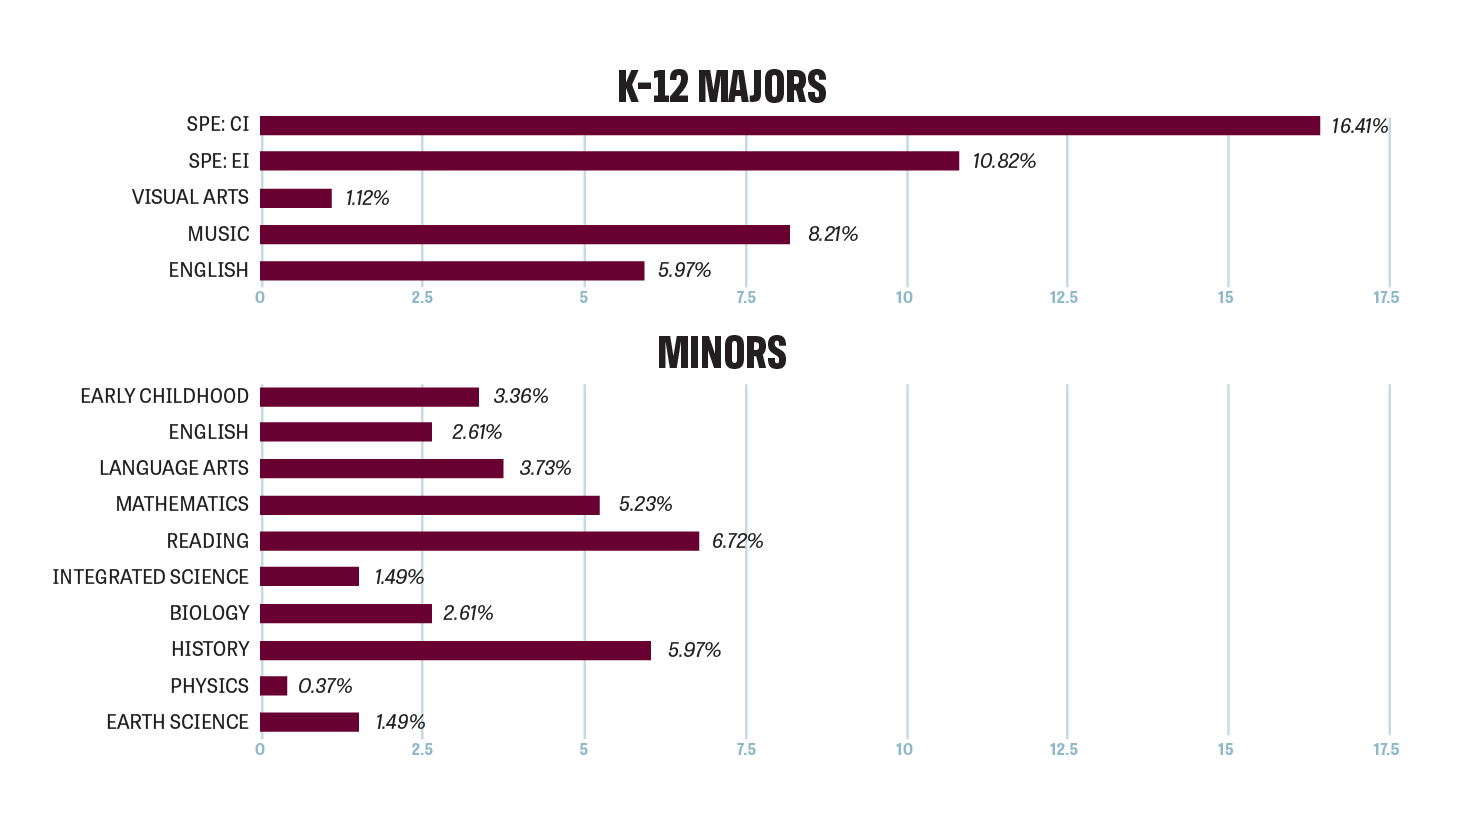
Major and Minor Distribution: program completers
2021-2022 total number completers=268

Measure 1: Completer impact and effectiveness
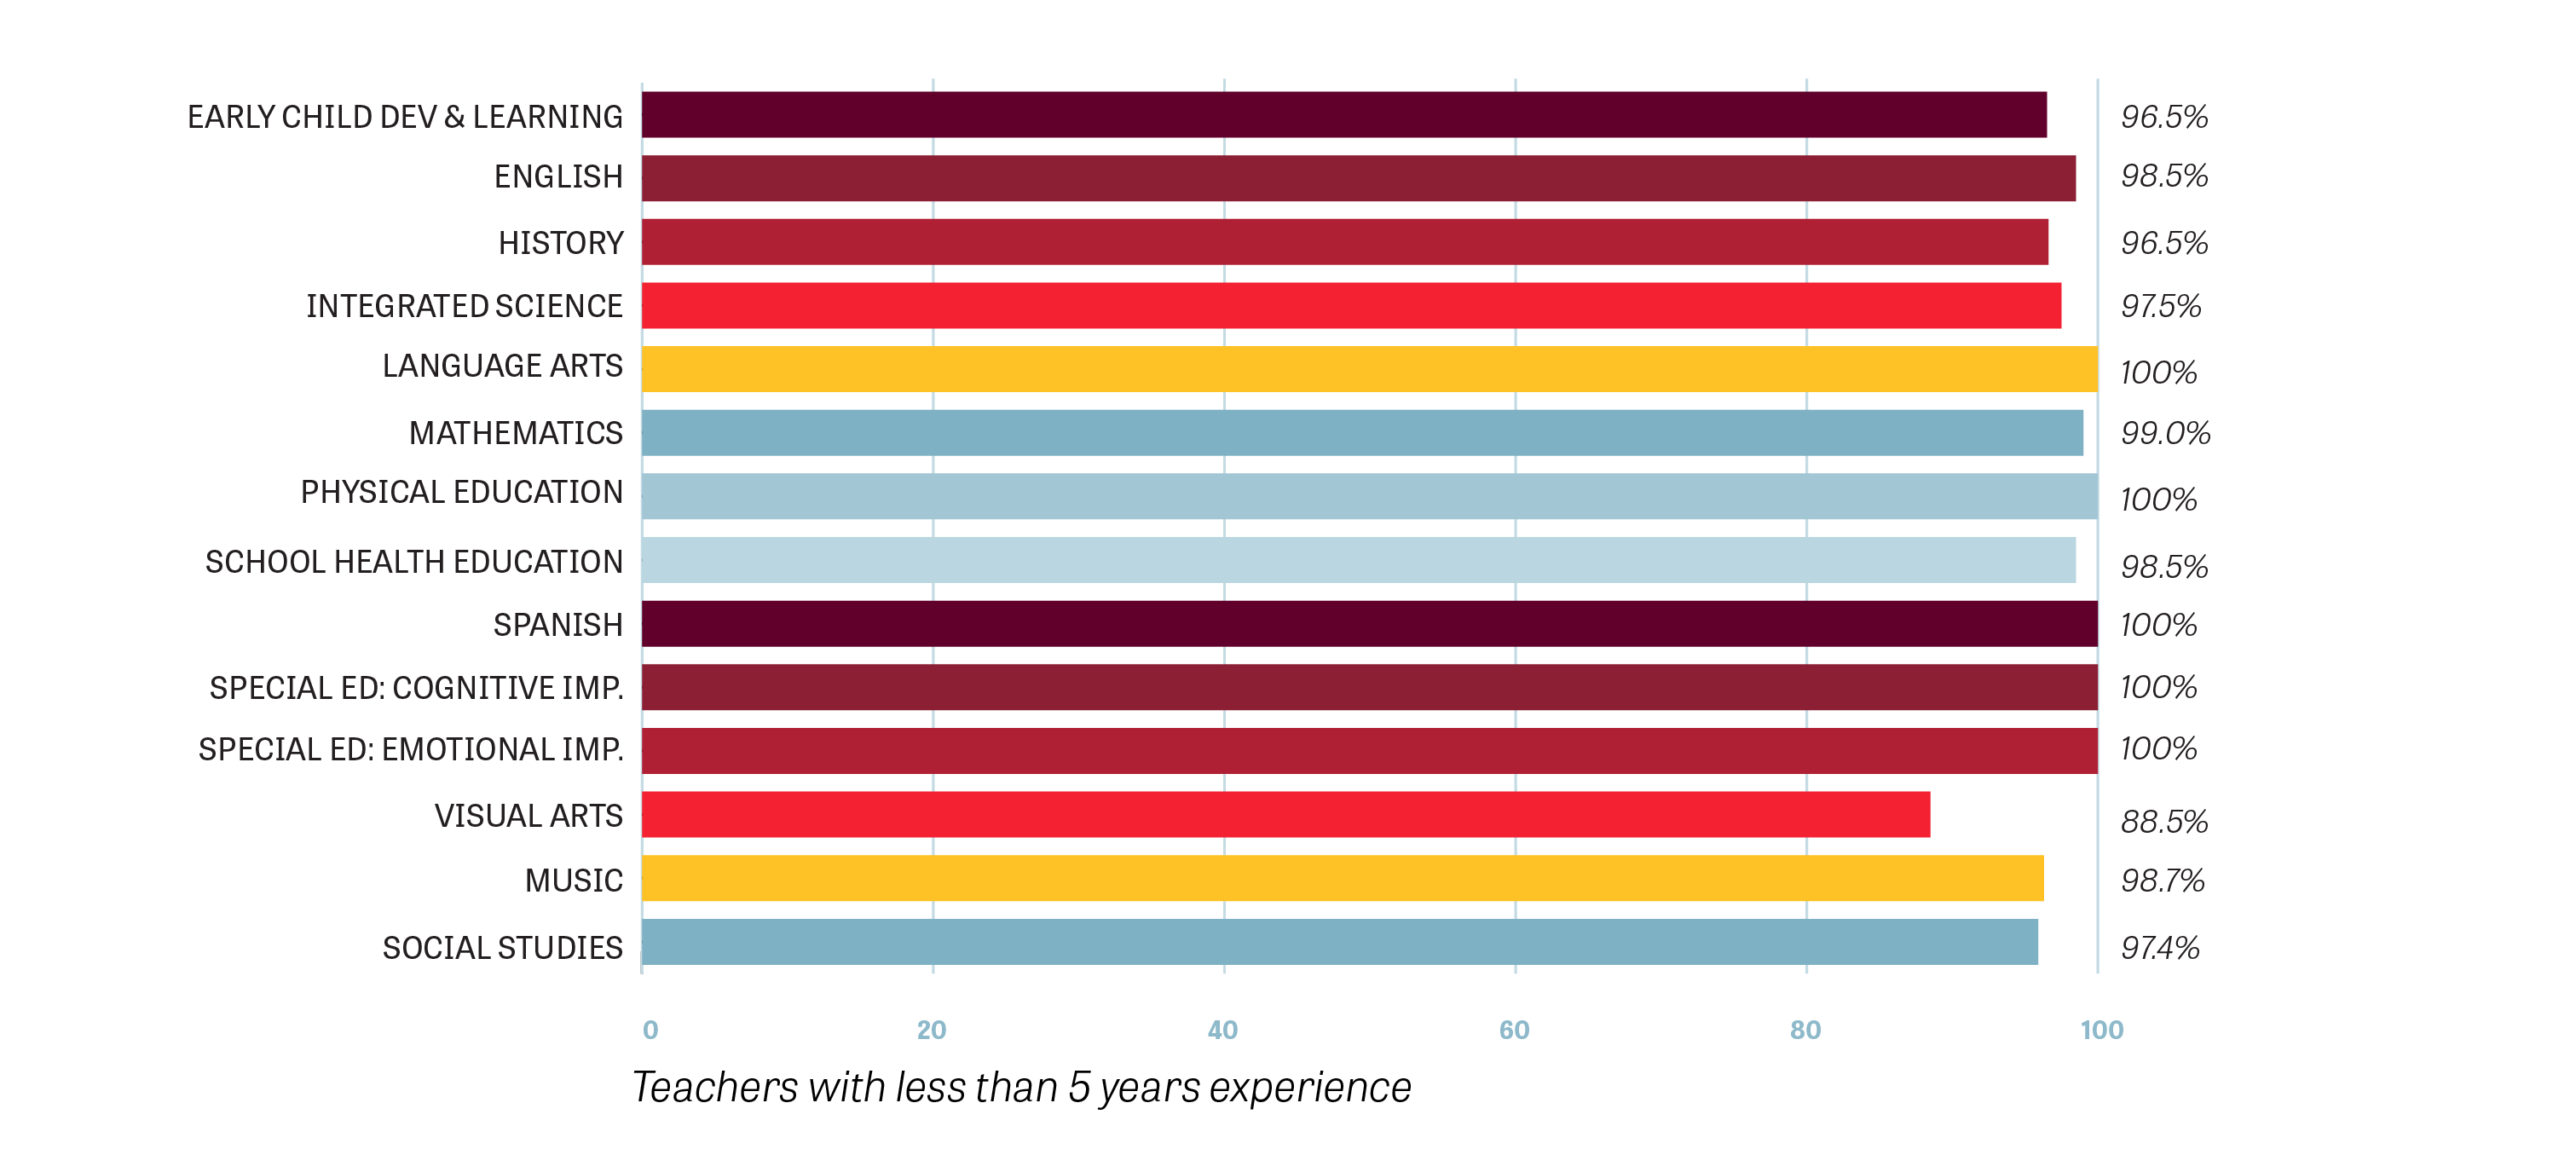
MDE Teacher Effectiveness Rating: 2021-2022 effectiveness ratings for education majors
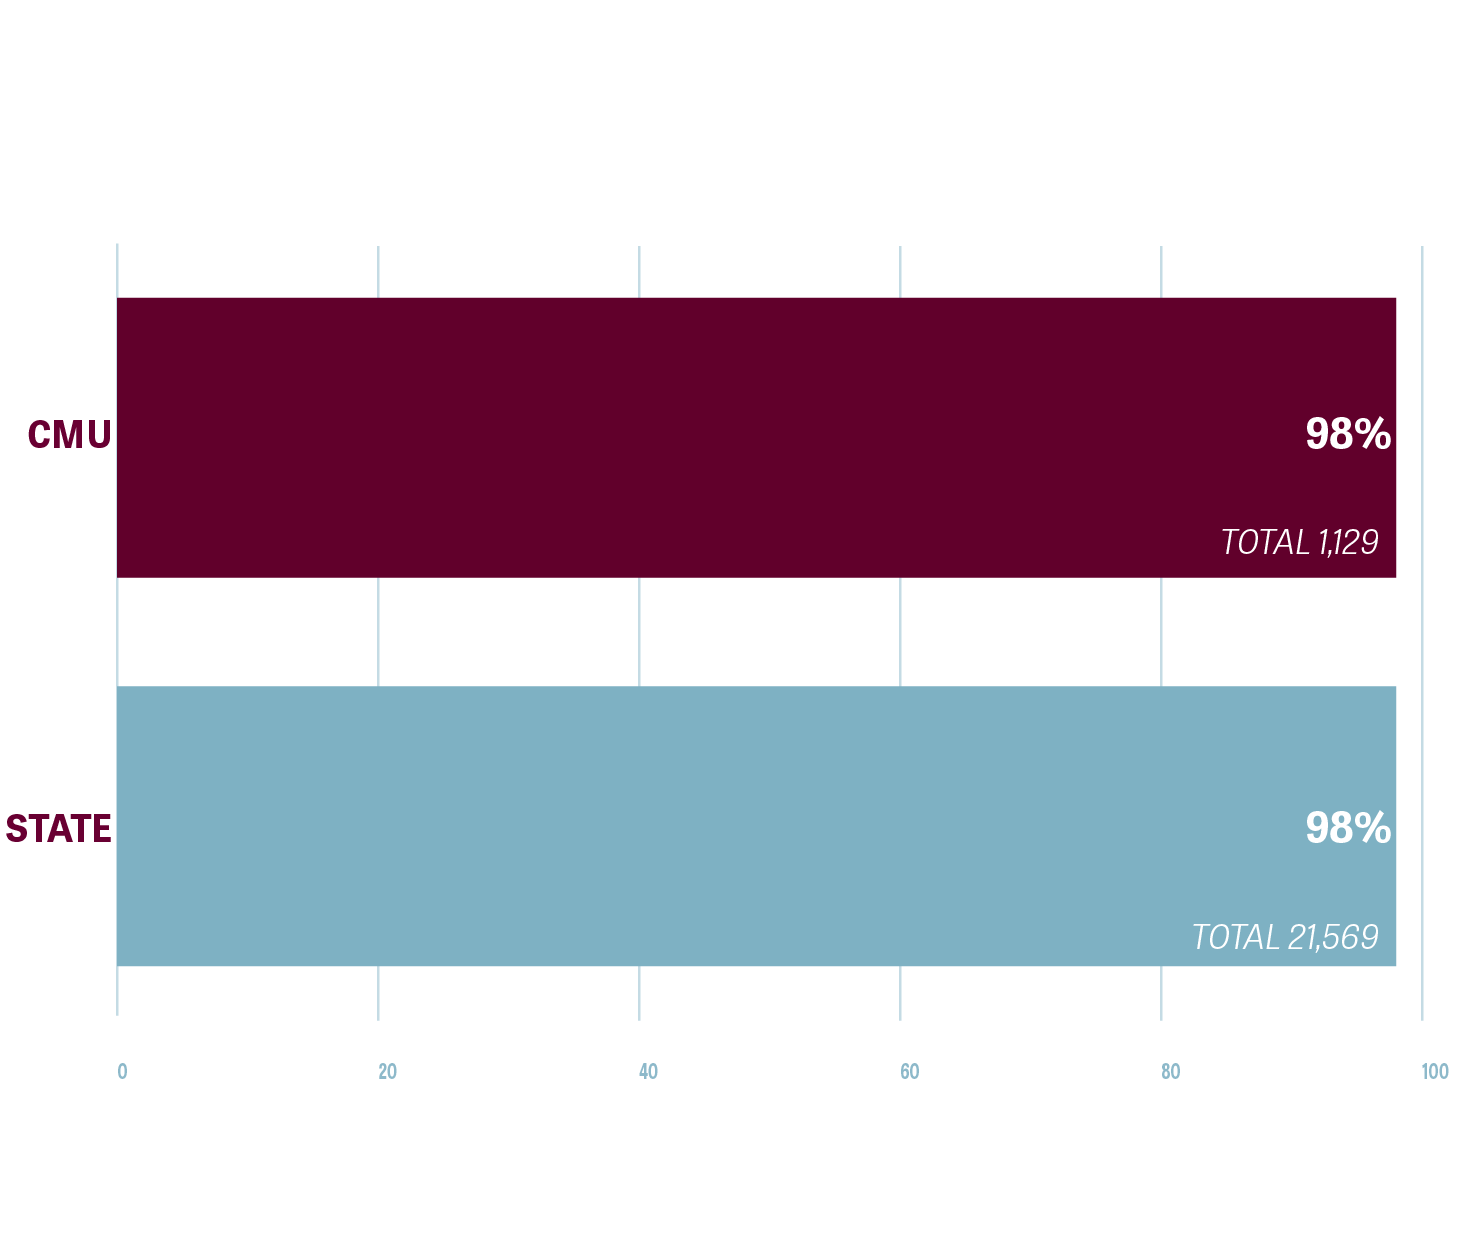
Percentage of teachers rated effective or highly effective
Average effectiveness rating for education majors
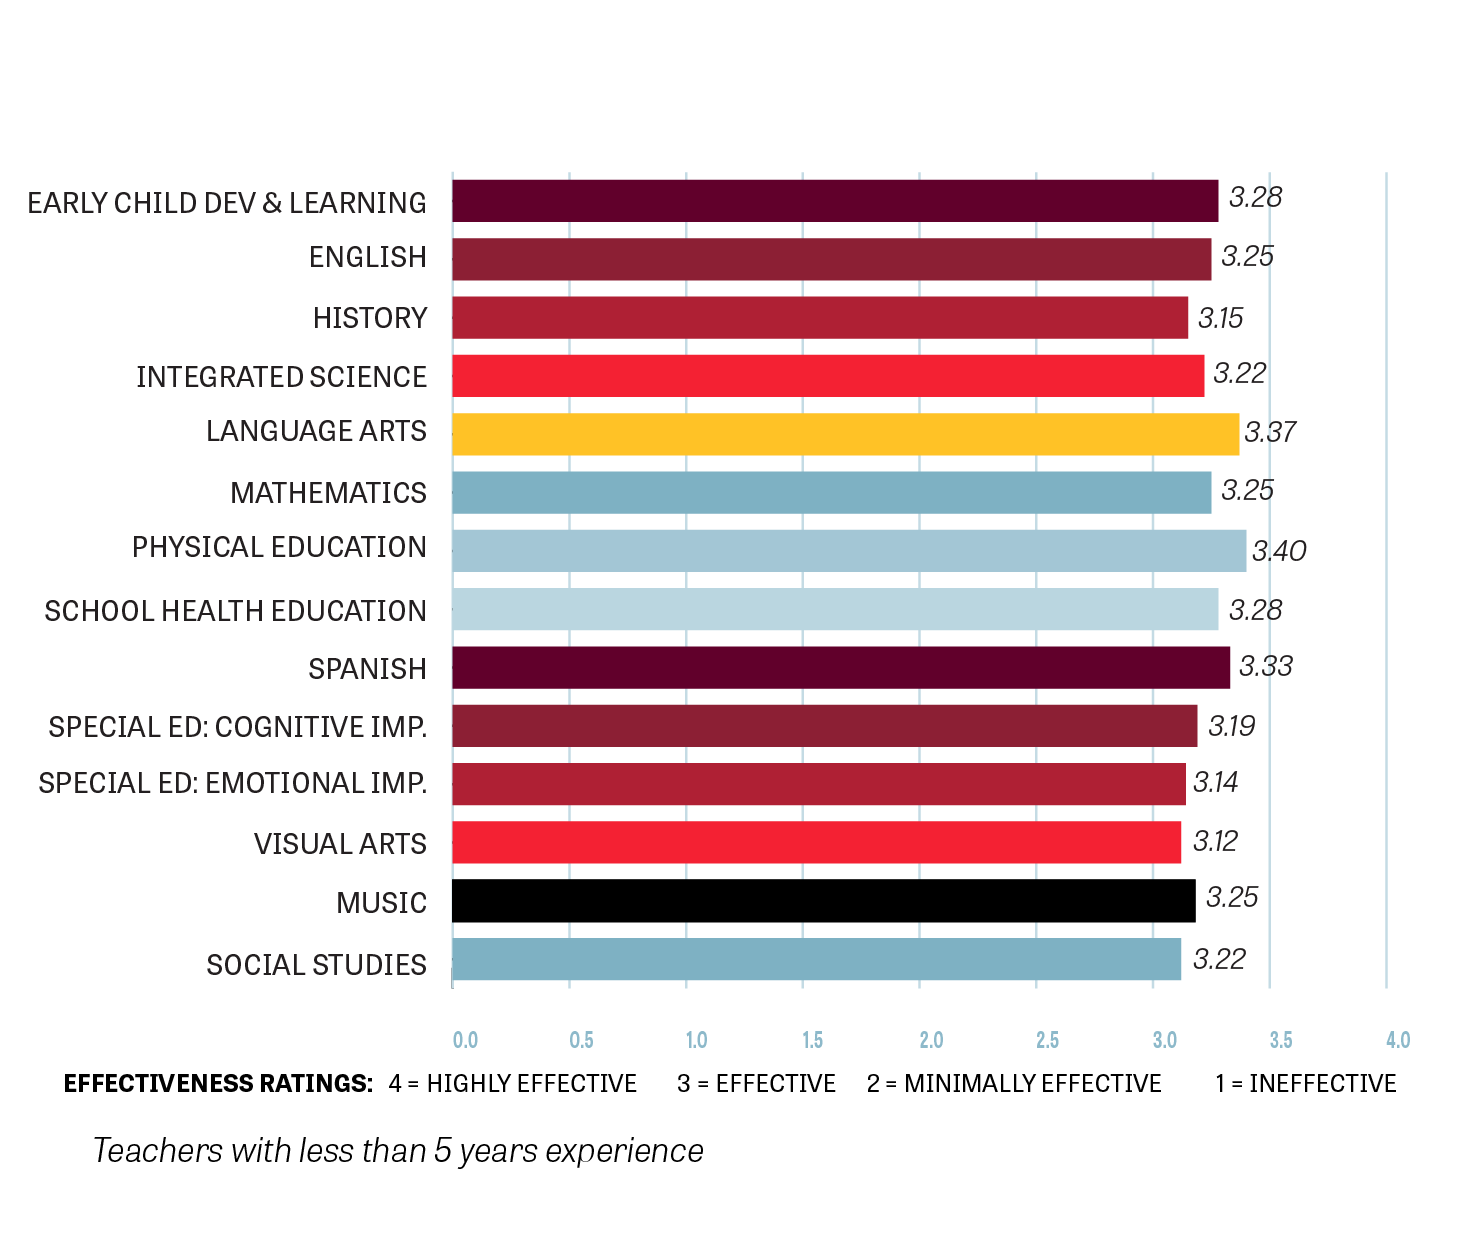
Total effectiveness rating for education majors
Measure 2: Satisfaction of employers and stakeholder involvement
Employer satisfaction
2021-2022 MDE administrator survey
| QUESTION: As a first-year teacher, compared to other first-year teachers, to what extent is [TeacherName] able to... | ||||
|---|---|---|---|---|
| State Average % Effective | State (N) | CMU % Effective | CMU (N) | |
| support all students in making connections to prior knowledge and experiences? | 93.1% | 534 | 87.2% | 47 |
| implement multiple strategies to present key content area(s) concepts? | 90.7% | 537 | 85.4% | 48 |
| utilize available technology to enhance the learning experience of students? | 98.6% | 536 | 91.3% | 46 |
| implement strategies which maximize student engagement to support positive student behavior? | 87.0% | 539 | 87.5% | 48 |
| organize the learning environment to guide student engagement during instructional time? | 87.5% | 538 | 89.6% | 48 |
| implement literacy and reading strategies appropriate to their content area(s) and grade level(s)? | 87.0% | 539 | 87.5% | 48 |
| differentiate instruction based on student assessment data to support each student's academic achievement? | 82.1% | 519 | 80.0% | 45 |
| support each student's socioemotional (e.g., social, emotional, psychological) development with instructional strategies and resources? | 86.9% | 536 | 83.0% | 47 |
| understand and make accommodations based on a student's IEP or Section 504 plan? | 84.1% | 511 | 77.8% | 45 |
| QUESTION: As a first-year teacher, compared to other first-year teachers, to what extent can [TeacherName] apply instructional strategies and resources to support... | ||||
|---|---|---|---|---|
| State Average % Effective | State (N) | CMU % Effective | CMU (N) | |
| English learners? | 82.3% | 339 | 72.4% | 29 |
| high performing students? | 88.1% | 488 | 85.7% | 42 |
| low performing students? | 86.9% | 535 | 81.3% | 48 |
| students experiencing trauma? | 84.3% | 491 | 78.3% | 46 |
| students from culturally diverse backgrounds? | 88.0% | 476 | 76.7% | 43 |
| students with special needs or disabilities? | 88.2% | 508 | 83.0% | 47 |
| each individual student's learning abilities and needs? | 87.1% | 536 | 81.3% | 48 |
| QUESTION: As a first-year teacher, compared to other first-year teachers, to what extent is [TeacherName] able to build positive relationships with. . . | ||||
|---|---|---|---|---|
| State Average % Effective | State (N) | CMU % Effective | CMU (N) | |
| students? | 93.9% | 538 | 93.8% | 48 |
| families/caregivers? | 89.7% | 517 | 84.8% | 46 |
| colleagues? | 92.8% | 538 | 91.7% | 48 |
| QUESTION: As a first-year teacher, compared to other first-year teachers, to what extent is [TeacherName] able to build positive relationships with. . . | ||||
|---|---|---|---|---|
| State Average % Effective | State (N) | CMU % Effective | CMU (N) | |
| demonstrate responsiveness and flexibility to unexpected situations which arise? | 88.1% | 537 | 85.4% | 48 |
| act in a manner consistent with ethical and professional educator expectations? | 94.8% | 537 | 93.6% | 47 |
| utilize constructive criticism to reflect upon and improve practice? | 93.6% | 534 | 89.1% | 46 |
Alumni feedback
Feedback from 2018-2019 Alumni that have been teaching for 3 years

93.8% of alumni surveyed felt well or adequately prepared to demonstrate dispositions, ethics, and behaviors appropriate to the profession.
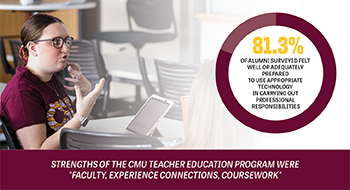
81.3% of alumni surveyed felt well or adequately prepared to use appropriate technology in carrying out professional responsibilities.
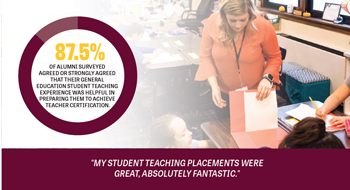
87.5% of alumni surveyed agreed or strongly agreed that their general education student teaching experience was helpful in preparing them to achieve teacher certification.
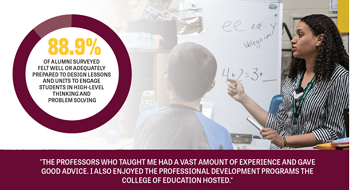
88.9% of alumni surveyed felt well or adequately prepared to design lessons and units to engage students in high-level thinking and problem-solving.

94.5% of alumni surveyed felt well or adequately prepared to teach content in their discipline (major/minor).
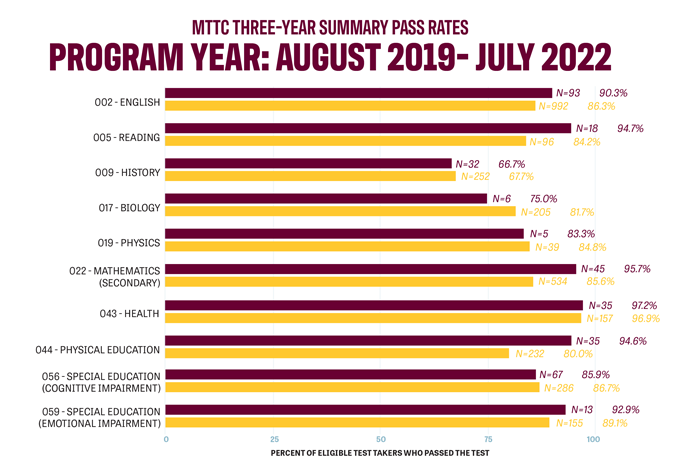
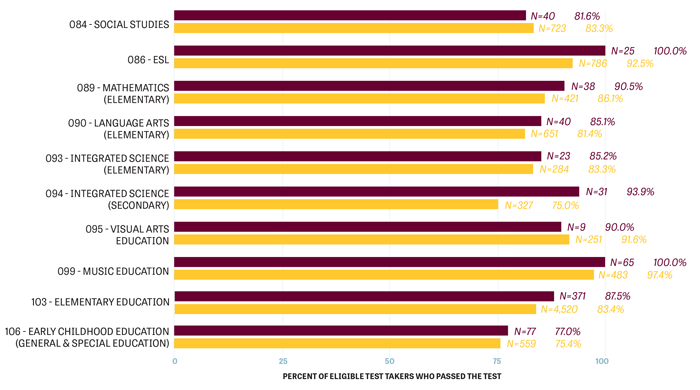
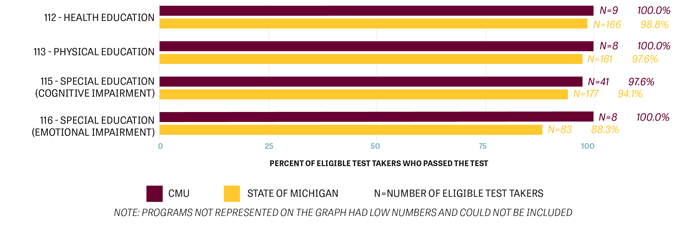
Measure 3: Candidate competency and program completion
Pass rates
Measure 4: Ability of completers to be hired in educator positions
Percentage of alumni teaching
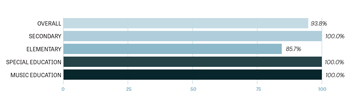
2018-2019 Alumni currently teaching

2018-2019 Alumni teaching full-time
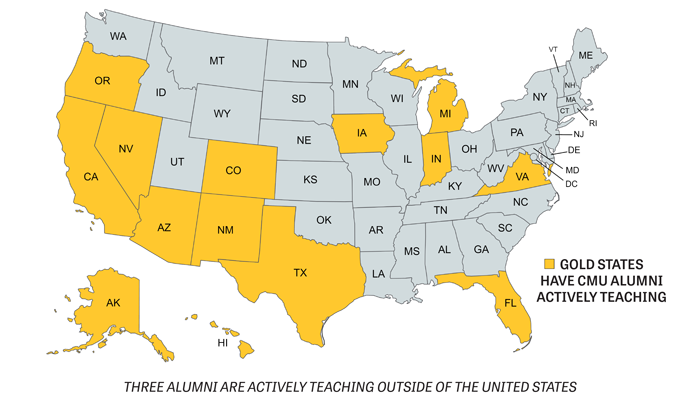
Where alumni are teaching: 2021-2022
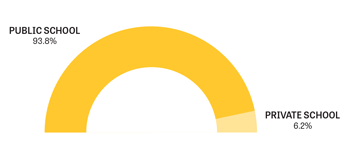
School type alumni teach at
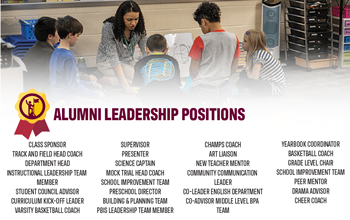
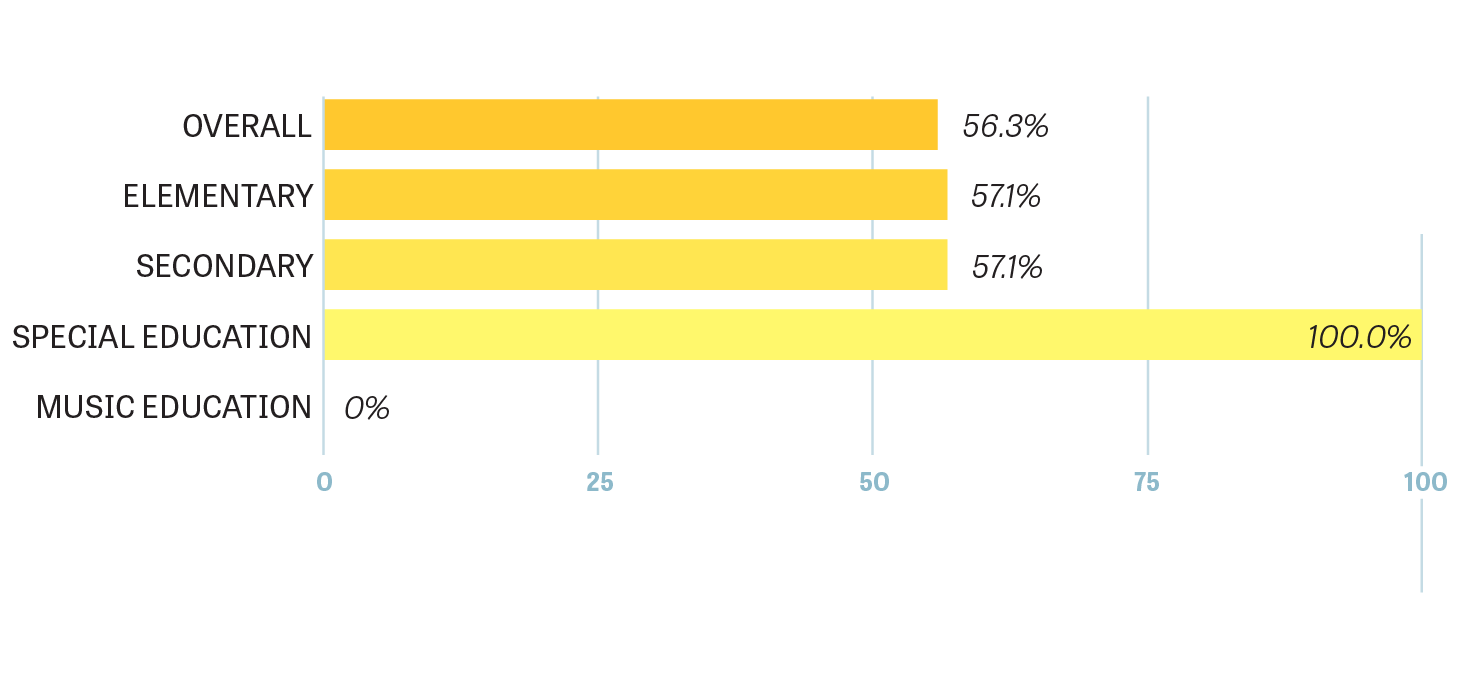
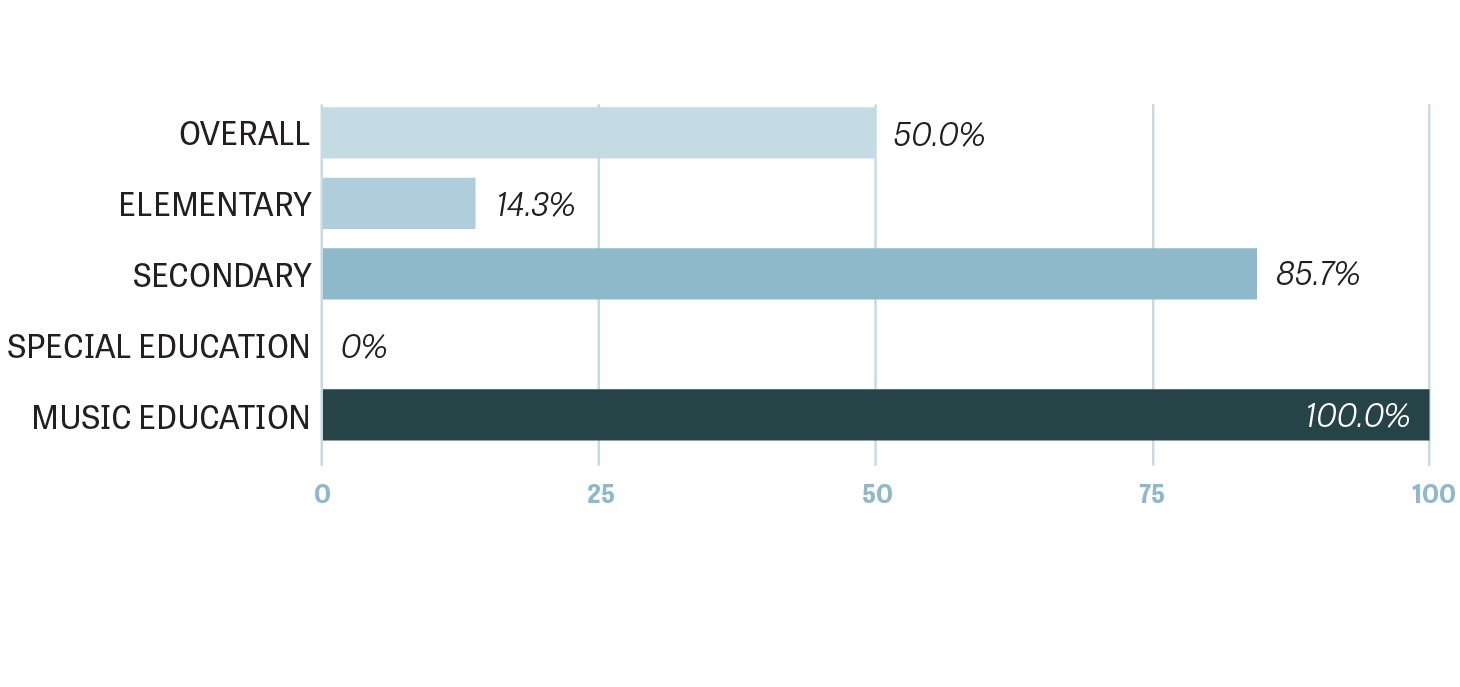
Awards and leadership
Percentage of 2018-2019 alumni surveyed
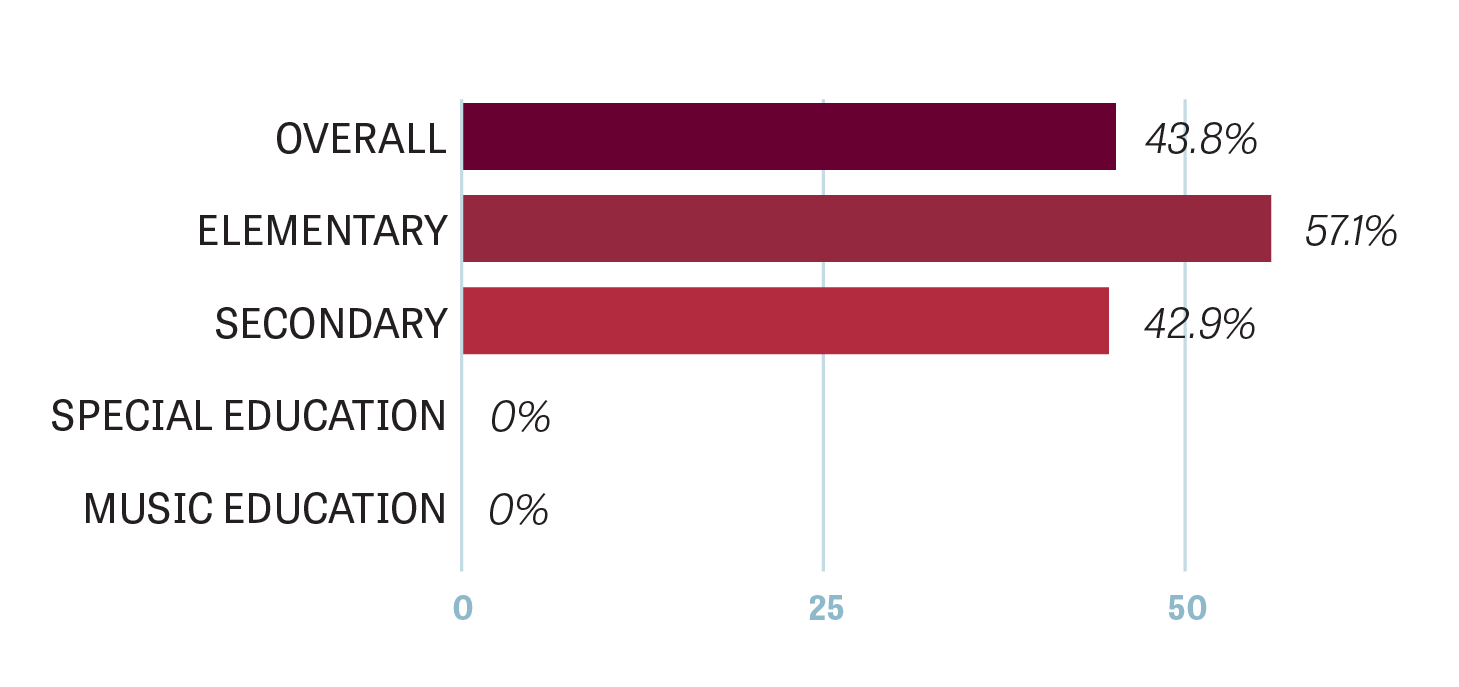
Enrolled in a graduate degree program
Regularly read professional literature
Belong to one or more professional organizations for teachers
Won one or more awards for teaching or service

Assumed leadership positions