Making sense of data
How CMU’s Data Visualization Competition turns numbers into stories—and prepares students for real-world impact
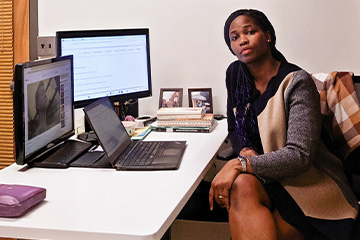
On a cold December morning in Grawn Atrium, the energy felt surprisingly warm. Students weren’t just sharing dashboards—they were sharing stories, insights, and the growing confidence that comes from understanding a complex world through data.
For Business Information Systems faculty member Shirley Huang, who launched CMU’s Data Visualization Competition, that’s exactly the point.
“In this event student will be asked to create a data visualization dashboard based on our provided data on the US housing market. And after doing this, they would be expected to present a story about what they learned from the data regarding the US housing market,” she said.
Her goal reaches far beyond one assignment.
“We are hosting this to help people understand that in the age of digitalization, many people struggle to make sense of data and often believe that only data scientists or those working in that field can do it,” she said. “I hope more students realize that they also have the ability to understand and work with data.”
That vision shapes not only her BIS 582 course, but the college’s broader mission: build students who can analyze information, communicate clearly, and lead with insight—no matter their major or industry.
Telling a story with data
Standing in front of students, faculty, and industry guests, Associate Dean Misty Bennett opened the award ceremony with a reminder that data skills matter not because of the tools, but because of the story.
“When you’re entering the business world, you use these tools to tell a story,” she said. “They help you explain why a decision makes sense and why it’s the right business case.”
She acknowledged that the fast-changing analytics landscape can feel overwhelming.
“There are so many tools out there. You ask yourself, how much do I have to know? And what do I have to learn?” she said.
But, according to Bennett, employer feedback has been consistent.
“Students don't have to know all of the tools. They need the skill set. They need to understand how to work with data. They need to understand how to tell a story with data.”
That focus has led to deeper integration of analytics—and now AI—throughout the CBA curriculum.
“We’ve taken that to heart and integrated it into our curriculum so students gain exposure to a wide range of tools,” she said. “We’re also actively working to incorporate AI into the curriculum.”
She closed with a line that drew smiles across the Atrium: “It is a cold Friday. There is nothing that can warm you up better than a good data set.”
Industry insight, mentorship, and connection
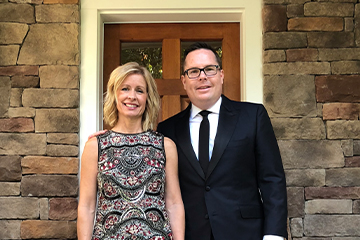
The event’s keynote speaker, Josh Ackerman—CMU alumnus and data scientist at Dow—brought two decades of industry experience to his talk, Transforming Data into Insights: How Visualization Drives Dow’s Customer Experience Journey. He showcased how visualization guides real decisions, from identifying customer expectations to estimating the impact of improving service.
His message reinforced what students were practicing that day: data is powerful when it’s applied.
Later, Jeffrey Trost, a CMU alumnus and information technology analyst at Dow, shared what it looks like to enter the analytics workforce. His advice focused on building a strong professional network, maintaining work-life balance, staying comfortable with uncertainty, and remaining curious and open to learning.
For students preparing to graduate or explore new opportunities, Trost’s transparency and encouragement offered a real-world look at how analytics careers begin—and how they grow.
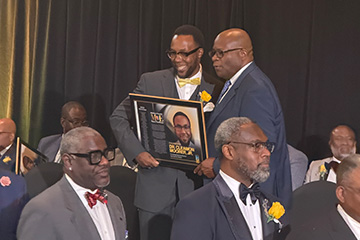
Celebrating excellence—and the power of practice
The morning’s presentations highlighted not only technical skill, but storytelling, curiosity, and problem-solving. Students presented dashboards shaped by hours of analysis, iteration, and reflection.
- Shiva Karthik Rallabandi and Rudresh Kale earned Overall Excellence Awards
- Chaitanya Kumar, Vineela Battu, and Rachelle Platt were honored for Best Analysis and Best Design
- Sai Sharath Reddy Yelma and Kalyan Kumar Dulla received Best Storytelling Awards
- Special Recognition Awards went to Que Tran Nguyet Huynh and Dhanalakshmi Kannur Munirathnam
Why it matters
Across the event, one message echoed: data literacy isn’t optional. It’s a differentiator. And at CMU, students don’t just learn concepts—they practice, collaborate, and present in ways that mirror the workplace.
The Data Visualization Competition shows what happens when students pair technical skills with curiosity and communication: they find their voice, strengthen their confidence, and discover how their work can make an impact.
Most importantly, they prove something true to the heart of the College of Business Administration—when students are given real-world challenges and real support, they rise.
And sometimes, they warm up an entire Friday morning with a really good data set.